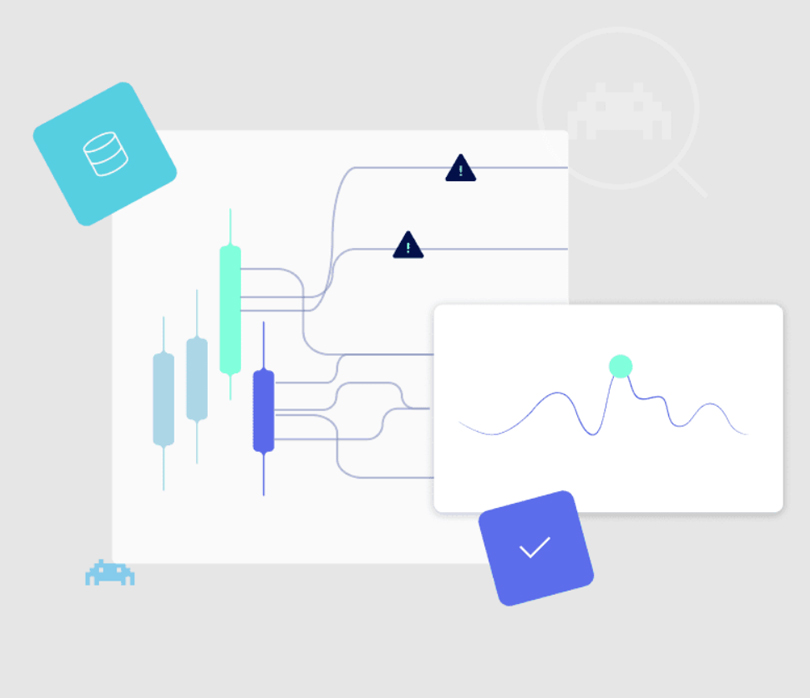

Simplify debugging
Capture traces of errors and anomalies, both in the lab and in the field. Powerful visualizations provide deep insights for rapid resolution.

Verify and optimize
Verify real-time requirements, avoid risks like stack overflow and memory leaks, and ensure the software runs efficiently on the selected processor.

Ensure reliability
Catch and solve elusive issues before they become a problem. Ensure deterministic software for stable performance and reliable testing.

Reduce costs
By spending less time on fault isolation, reproduction, and remediation, you lower your project and maintenance costs.

Grow your business
When your products always perform as expected, customers stay and help you grow your business by recommendations and positive reviews.

Focus on innovation
Take runtime anomalies out of the equation, and spend more time creating and deploying the cool products that customers love.
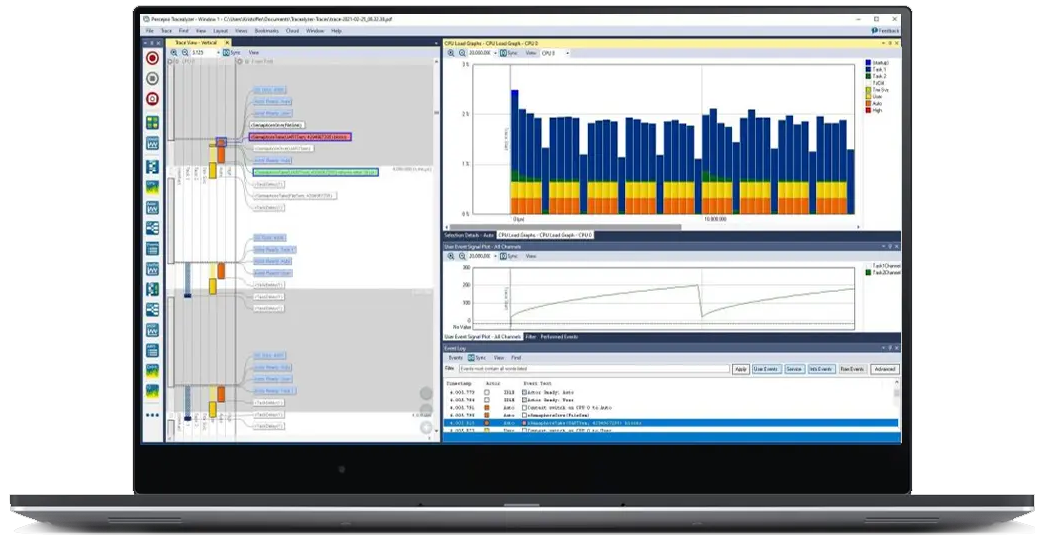


Tracealyzer
Percepio® Tracealyzer combines software tracing with powerful visualizations, allowing users to spot and analyze issues in software recordings during development and testing.

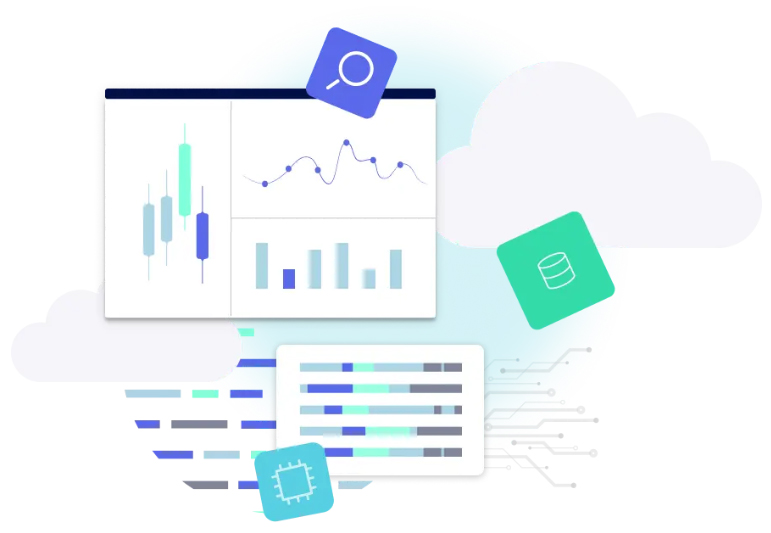
DevAlert
Percepio® DevAlert is a cloud-connected monitoring framework for OEMs developing RTOS device software, providing instant insight on bugs and anomalies.